Abstract
Background
Federal rules clarifying clinical trial reporting requirements took effect in 2017, implementing Section 801 of the Food and Drug Administration Amendments Act (FDAAA) of 2007 with penalties for noncompliance. This study examines how reporting rates changed after these regulations across different trial types, funding sources, and other characteristics. To compare with previous research, we closely follow the methodology from Anderson et al.’s study which examined trials subject to the FDAAA mandate prior to the rule publication.
Methods
This analysis compared FDAAA-mandated trial reporting compliance across two windows: 2010–2014 completions (Window 1) and 2017–2021 completions (Window 2), tracking each trial’s reporting status for 3 years post-completion. The study evaluated 12-month reporting compliance rates between the windows and analyzed patterns across trial characteristics. Analyses were conducted both with and without consideration of regulatory reporting extensions.
Results
We identified trials on ClinicalTrials.gov that were likely subject to FDAAA provisions, referred to as highly applicable clinical trials, or HLACTs. In Window 1 (2010–2014), 14,174 HLACTs were identified, and in Window 2 (2017–2021), 9,880 HLACTs were identified, all with completion dates before or after the rule effective date, January 18th, 2017. Twelve-month reporting rates increased from 8.3% to 23.2% (+14.9%) while 36-month rates increased from 40.8% to 49.2% (+8.5%). Improvements in rates occurred across all trial characteristics (funding source, trial phase, intervention type, and trial purpose). While Anderson et al.’s study found NIH-funded trials lagging behind industry trials, post-2017 rates became similar with NIH and industry at 32.2%/31.5% within 12 months and 62.0%/67.1% within 36 months respectively.
Conclusion
Overall, across all trials and all sub-categories, we observe improvements in compliance rates after the 2017 mandate, particularly among NIH-funded trials. However, despite improvements in compliance, the majority of trials remain non-compliant. Among post-mandate trials, % failed to report results within 12 months and % had not reported within 36 months. These persistent low rates suggest that additional policy measures or structural changes may be needed to achieve the transparency goals of the FDAAA Section 801. Understanding and addressing the barriers to timely reporting remains critical for advancing public health and medical research.
Affiliations:
Zakariyya Mughal, MSc, Insilica.co, Bethesda, MD, USA
Rosita Fu, BSc, Insilica.co, Bethesda, MD, USA
Thomas Leuchtefeld, PhD, Insilica.co, Bethesda, MD, USA
Karen Chiswell, PhD, Duke Clinical Research Institute, Durham, NC, USA
Nicole Kleinstreuer, PhD, NICEATM, NIEHS, RTP, NC, USA
Gary Shaw, PhD, Stanford University School of Medicine, Stanford, CA, USA
George F. Tidmarsh, MD, PhD, Stanford University School of Medicine, Stanford, CA, USA
Correspondence: [email protected]
Submitted 02/09/2024
1 - Background
Historically, results from clinical trials involving human experimentation have been withheld from public view, raising concerns about transparency in clinical research. To address this, in 2000, Congress established the registry ClinicalTrials.gov, operated by the National Library of Medicine (NLM) of the National Institutes of Health (NIH).1
Subsequently, the Food and Drug Administration Amendments Act of 2007 (FDAAA) Section 8012 mandated that applicable clinical trials (ACTs) must submit their summary results to the ClinicalTrials.gov data-bank one year from study completion. This regulation went into effect under the “Final Rule” on January 18, 2017 and compliance was required from April 18, 2017 for all responsible parties.3,4,5,6 Penalties for non-compliance include fines, loss of federal funding, and public disclosure of non-compliance.
Previous work by Anderson et al.7 examined the ClinicalTrials.gov database between the 2007 reporting requirement and the 2017 “Final Rule.” They found that only 13.4% of applicable trials reported results within the required 12-month window after trial completion. Similarly, Riley et al.’s8 analysis of pulmonary trials during this period found a 15% compliance rate.8
DeVito et al.9 conducted the first evaluation of compliance after the Final Rule implementation, examining trials from 2017. They reported a 40.9% compliance rate for results reporting within the one-year deadline.9 While DeVito’s study used a more flexible approach to assessing compliance (accounting for trial extensions and other permissive modifications), the present study employs a more direct interpretation of the policy requirements and accounts for extensions in the provided supplement. This analysis extends previous work substantially by examining trials completed through 2021, providing a longer four-year window after the Final Rule implementation.
Seven years after the FDAAA Final Rule’s 2017 implementation, we seek to evaluate how compliance rates have changed.
2 - Methods
As there is no definitive way to determine which clinical trials were subject to FDAAA provisions, we followed the algorithm developed by Anderson et al.7 to identify trials that are likely to be ACTs, which they term highly likely applicable clinical trials (HLACTs). The criteria for applicable trials in our sample include interventional trials of drugs, medical devices, or biologics in trial phase 2, 3, or 4, meeting criteria for FDA oversight (table 1).

To validate our methodology, we compared our implementation of Anderson et al.’s7 algorithm against their original dataset.10 Our analysis of trials classified as HLACTs closely matched their results, as detailed in section 5.1.
2.1 Definitions
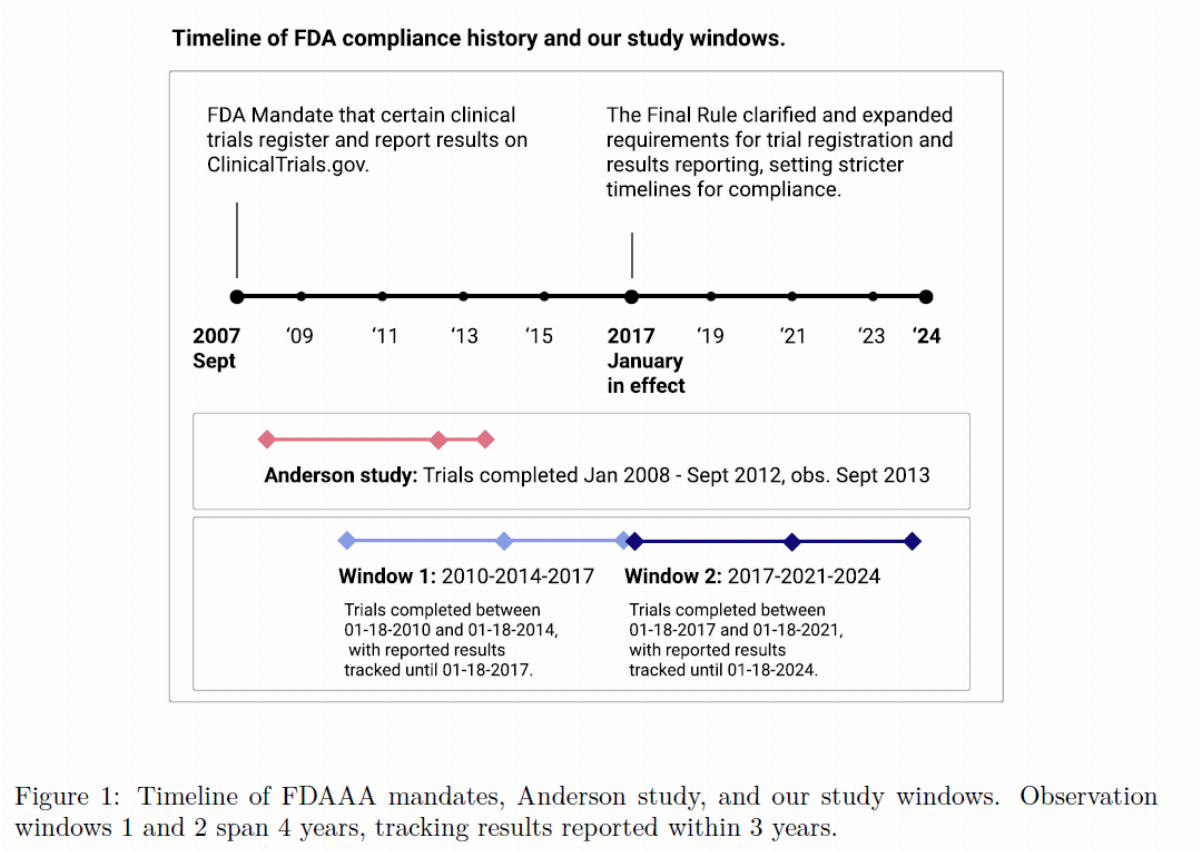
Observational windows: Anderson et al.7 looks at studies with completion dates from January 1, 2008 to September 1, 2012. This time frame is associated with a cut-off date of when the dataset was downloaded from ClinicalTrials.gov on September 27, 2013. These three dates define an observational window in which we can track the number of months after trial completion until a given trial has submitted their results.
In a similar manner, to evaluate compliance rates before and after the 2017 mandate, we constructed two equivalently sized windows. Window 1: trials completed between January 18th of 2010–2014, tracked until 2017. Window 2: trials completed between January 18th of 2017–2021, tracked until 2024. As per the Final Rule’s text, trials in Window 2 must have started after January 18, 2017, since the regulation only applies to trials that began after this effective date.
To better understand the nature of this change over time, we additionally constructed annual windows from 2008–2009, … 2020–2021, and track reporting rates for 36 months. All analyses were done without accounting for extensions that allow for delayed results reporting. We would otherwise not be able to track the reported results of trials with completion dates closer to 2021 that were granted extensions. This approach provides a conservative estimate of compliance, as there are more trials that are in compliance when accounting for extensions, as shown in the supplemental analysis (fig. 11).
The trial characteristics and their subgroups considered are:
Funding source: Industry, NIH, Other academic or government institution;
Trial phase: Phase 1/2, 2, Phase 2/3, 3, Phase 4, Phase N/A;
Intervention type: Drug, Biologic, Device, Other; and
Trial primary purpose: Treatment, Prevention, Other.
Trials are classified based on their funding sources in the following priority order:
1. If NIH is the lead sponsor or a collaborator (unless Industry is the lead), the trial is classified as NIH-funded.
2. If Industry is the lead sponsor or a collaborator, the trial is classified as Industry-funded.
3. All other trials are classified as Other.
Trials funded from “Other” sources include government agencies, academic institutions, and nonprofit/private organizations. Trials with “N/A” phase may include diagnostics or devices that don’t follow the same progression as drug trials, or trials for expanded access or compassionate use that offer experimental therapies to patients outside of a traditional clinical trial setting.11 Trials categorized as “Other” intervention types include trials for behavioral studies, procedures, or diagnostics. Trials categorized as having “Other” primary purpose include studies for educational/counseling/supportive care, screening, health services research.12
2.2 Data Sources
The ClinicalTrials.gov database allows investigators to modify trial information, including fields like start date and completion date, even after a trial has been completed. This ability to update metadata complicates the process of reproducing historical studies. To obtain data as close to that of [10], we used the ClinicalTrials.gov API to retrieve all versions of study records by their NCT numbers from the database13 as of April 30, 2024. These records are stored in the form (NCTID, version, change-date, study-record), allowing us to retrieve the latest version of each record as it existed at our window’s cut-off date. After filtering records by the cut-off date, the rest of the algorithm is applied as shown in section 5.1.1.
Rates of reporting within 12 months and reporting within 36 months are presented for HLACTs in Window 1 and Window 2, alongside the difference in rates between the windows. These analyses are also conducted across various subcategories and demonstrate differences between subcategories, as well as the percent change within each subcategory.
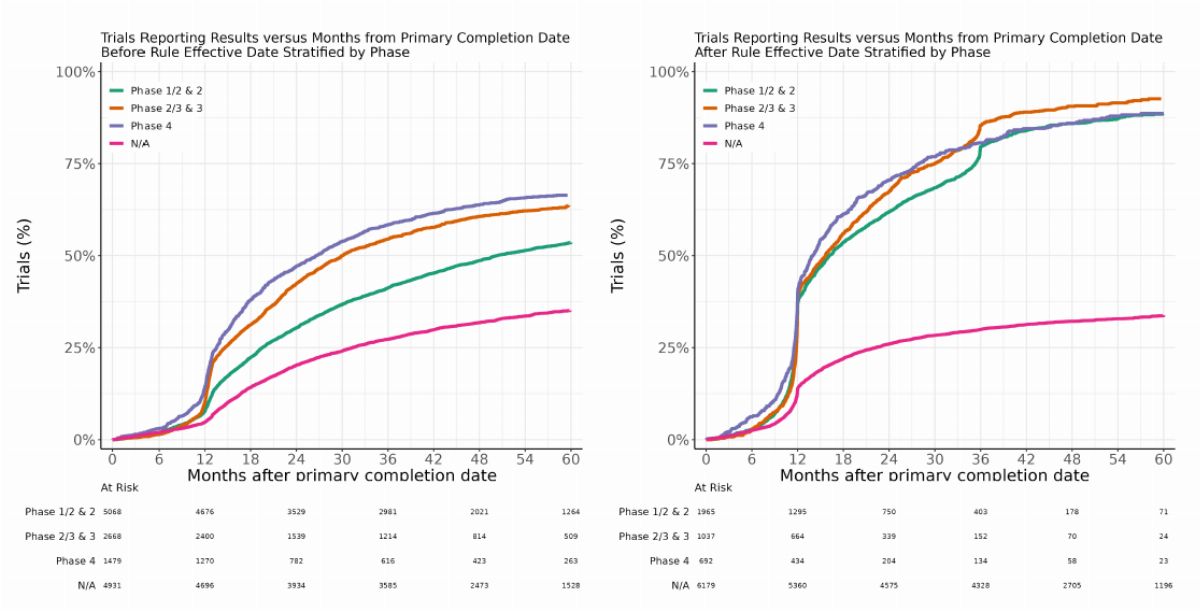
Kaplan-Meier survival curves show the cumulative percentage of trials that reported results from the completion date, and are stratified by sub-category and separated by windows. The slopes and magnitude of these curves serve as a more continuous way to understand rates of reporting over time, instead of a binary separation of “reporting within 12 months” and “reporting within 36 months.” This survival analysis was conducted using the ggsurvfit software package in R.14
A permutation test was conducted to assess the significance of the observed difference between Window 1 and Window 2 at a significance level of alpha = 0.001 and N = 50,000 repetitions. The test repeatedly shuffles the window assignments randomly across trials and recalculates the difference in reporting rates. The p-value represents the proportion of permutations that produce a difference as extreme as or more extreme than the observed difference. Additionally, to account for potential trial classification errors, we report confidence intervals of the difference in proportion of trials reporting within 12 months and 36 months between Window 2 and Window 1, using N = 10,000 repetitions. The permutation test was implemented using a shuffling procedure from NumPy.15
3 - Results
3.1 Window 1 & Window 2 Rates of Reporting
Results show a +14.9% increase in trials reporting within 12 months, from 8.3% in Window 1 to 23.2% in Window 2. Reporting within 36 months increased by +8.5%, from 40.8% to 49.2%. Despite these improvements, a majority of trials in Window 2 remained out of compliance (76.8%), and roughly half (50.8%) did not report within 36 months (fig. 2). Similar patterns emerge when accounting for regulatory reporting extensions: Window 2 showed an +18% increase in 12-month reporting and an +8.5% increase in 36-month reporting compared to Window 1 (fig. 11).
Differences in compliance rates within stratified groups (fig. 3) show increased compliance across all subgroups, with variation.
Funding: In Window 2, both Industry and NIH-funded trials had nearly identical reportingrates, with 31.5% and 32.2% of trials reporting within 12 months respectively. By 36 months, Industry-funded trials had a slightly higher reporting rate compared to NIH-funded trials(67.1% vs. 62.0%). However, NIH-funded trials showed significant improvement from Window 1 to Window 2, with reporting rates increasing from 39.2% to 62.0%.
Intervention type: Biologics and Drugs have had much higher rates of timely reporting compared to Devices. In Window 2, reporting rates for Biologics at 12-months and 36-months were 45.3% and 85.2%, Drugs were 37.9% and 81.5%, and Devices were 30.0% and 64.0%, respectively.
Phase: Reporting rates are comparable across trial phases, with later phases having slightly higher rates.
Purpose: Treatment trials had higher rates of timely reporting than Prevention trials in both windows.
After excluding trials classified as ‘Other’ or ‘N/A’ in their Funding, Phase, Intervention Type, or Purpose (which showed modest +5% to +9% improvements), the remaining defined categories showed a substantially larger median improvement of +21.3% in timely reporting within 12 months.
When comparing compliance rates across Window 1 and 2, differences in trial type distributions in the two windows is something to consider. This topic is explored more in section 5.2.
Kaplan-Meier survival curves, stratified by funding source, reveal that industry and NIH-funded trials had very similar compliance rates in Window 2, in contrast to Window 1 (fig. 4). Trials funded by other government agencies and academic institutions showed no meaningful improvement in compliance between the windows. Additional Kaplan-Meier curves, illustrating trends by intervention type and trial phase, are presented in section 5.3.


3.2 Annual Windows: Rates of Reporting, Time to Report
Annual windows provide a more holistic view of compliance from 2008 to 2021. There has been a steady increase in timely reporting: 12-month reporting rates rose from 3.6% to 28.2% from the 2008–2009 window to the 2020–2021 window, and 36-month reporting rates increased from 24.4% to 55.2% over this period.
Compliance generally improved by 1–3% per year, except during 2015–2016, when the rate jumped from 13.6% to 21.0% (+7.4%). This coincides with Anderson’s publication in 2015 and suggests anticipation of the FDAAA 2017 reporting mandate. Overall, reporting compliance has seen significant improvements, with 55.2% of trials now reporting within three years of completion (fig. 5(a)).
For trials that report within 36 months, the distribution of months to report has declined from roughly 13–25 months to 11–18 months (25th–75th percentile). The median has also steadily declined from 15 months to 12 months (fig. 5(b)). The proximity of the 25th and 50th percentiles post-2017 indicates that many trials are reporting very close to the deadline. Additionally, the total number of reporting trials has increased, demonstrating that not only is the median time decreasing, but more trials overall are reporting more quickly.


3.3 Statistical Analysis
A permutation test was performed to assess whether the observed differences between Window 1 (N = 14,174) and Window 2 (N = 9,880) reporting rates could have occurred by chance. The test repeatedly shuffles the window assignments randomly across trials and recalculates the difference in reporting rates. The p-value represents the proportion of permutations that produce a difference as extreme as or more extreme than the observed difference. For both the 12-month and 36-month reporting rates, p-values less than 0.001 were obtained, indicating that the probability of observing such large differences between windows due to random chance is extremely small.
4 - Discussion
The history of reporting requirements for clinical trial results reflects a long-standing need for transparency in research involving human subjects. ClinicalTrials.gov, established by Congress in 2000, was envisioned as a centralized resource for information and results data on clinical trials; however, it was the Food and Drug Administration Amendments Act (FDAAA) of 2007 that introduced the regulatory framework requiring the formal reporting of trial results. Under FDAAA 801, sponsors of applicable clinical trials (ACTs) were required to submit summary results within a year of trial completion. Compliance with these regulations became enforceable through the FDAAA 2017 Final Rule, which introduced penalties for non-compliance, including fines, the potential loss of federal funding, and public disclosure of non-compliance. This change was a significant regulatory step aimed at improving transparency and accountability in clinical research.
Prior to the 2017 mandate, there was a lack of timely reporting, with only 13.4% of trials reporting results within 12 months.7 Our analysis shows a marked improvement, with timely reporting increasing from 8.3% (2010–2014) to 23.2% (2017–2021). Reporting within 36 months also rose, from 40.8% to 49.2%. The permutation test provides strong statistical evidence that the improvements in reporting rates between Window 1 and Window 2 (12 months: +14.9%, 36 months: +8.5%) represent genuine changes in trial reporting behavior. These findings are consistent across all stratified subcategories (table 2).
Compliance varied across trial types, with device trials lagging behind drugs and biologics. This may reflect strict regulatory oversight of pharmaceutical interventions, generally with more structured timelines and well-defined reporting requirements, whereas different device types have varying reporting requirements and often involve longer timelines that require iterative development. Industry- and NIH-funded trials now report at similar rates, reflecting the impact of penalties like loss of federal funding. While our study examines compliance with FDAAA requirements through HLACTs, it’s important to note that NIH-funded trials in our sample were also subject to the “NIH Policy on the Dissemination of NIH-Funded Clinical Trial Information” implemented simultaneously.16 This policy applies to all NIH-funded trials, whether or not they are ACTs under FDAAA. Therefore, NIH-funded trials in our sample were under both mandates, which may have contributed to the improved compliance we observed among NIH-funded trials. Future studies examining the broader population of NIH-funded trials, including those not subject to FDAAA, would provide a more complete picture of this complementary NIH policy’s impact on research transparency.
Limitations of our study include not accounting for trials that have requested and been granted extensions in our primary analysis, the ability of studies to modify their completion dates, and the likely preponderance of studies which remain “open” despite internal decisions to discontinue. However, these analyses suggest that the 2017 mandate has positively influenced reporting practices, even if compliance rates are still far from ideal.
The improvement in reporting rates reflects multiple influences: the 2017 FDAAA Final Rule introduced enforcement mechanisms, including public accountability and financial penalties (though the potential $10,000-per-day fine is seldom levied) and efforts by the NIH have focused on building tools that simplify reporting processes via more user-friendly submission platforms and automated reminders. Public tracking tools like the FDAAA TrialsTracker have emerged to monitor compliance in real-time and support accountability. These tools not only help regulators identify non-compliant trials but also assist sponsors in tracking their own reporting obligations, potentially serving as a practical solution to improve overall compliance rates. Additionally, evolving institutional policies and shifts toward reproducibility in research practices, including federal mandates, internal ethical standards, and international harmonization contribute to increased compliance. Public advocacy campaigns and media scrutiny have heightened awareness and pressured organizations to prioritize transparency. Together, these elements have created a slightly more robust framework for supporting timely and accurate reporting of clinical trial results.
Despite improved compliance rates since the 2017 FDAAA Final Rule mandate, significant barriers to timely clinical trial reporting persist. In 2022, the Clinical Trials Transformation Initiative (CTTI) conducted 26 interviews with investigators and sponsors of applicable trials, aiming to identify specific challenges they face. The report17 identified gaps in clinician understanding of which trials require registration and when to submit results. This further indicates the need for communication and trial reporting tools to support and ease the process of trial reporting. Some sponsors are hesitant to post results, particularly if the trial outcomes are negative or inconclusive, due to reputational impact or future funding risks. Additionally, the reporting process itself can be complex and time-consuming, with researchers citing technical difficulties, issues with data entry, and unclear guidance as barriers. Academic institutions, in particular, often lack the resources and specialized staff required to meet stringent reporting timelines compared to industry sponsors.
The challenge of timely reporting should not be viewed solely as a compliance issue. Clinical researchers face significant practical hurdles in meeting reporting requirements, including the need to ensure HIPAA compliance when handling patient data and the substantial time investment required to format and input data into ClinicalTrials.gov’s system. Rather than focusing on enforcement alone, developing better computational tools and systems to support efficient, compliant FAIR data submission could help improve reporting rates. Such tools could automate parts of the submission process, provide clear guidance on reporting requirements, and help ensure data quality while reducing the administrative burden on clinical research teams. Beyond the obvious enforcement actions, addressing these root causes could help further boost compliance rates. For example, simplifying the user interface on ClinicalTrials.gov, providing more robust support for academic researchers, or revising publication-related restrictions could remove barriers and encourage more rapid reporting.
In summary, our findings indicate that compliance rates have improved since the 2017 FDAAA Final Rule mandate, with more trials reporting results within 12 and 36 months of completion. This increase in compliance has been influenced by a combination of regulatory, institutional, and societal factors. Despite these improvements, a majority of trials still remain out of compliance, with around 50% failing to report within three years. With the advent of artificial intelligence and continuously improving computational modeling capabilities, comprehensive access to data becomes even more critical to support generation of large-scale knowledge networks that will yield insights into human disease. Facilitating timely reporting of clinical trial results is not only a regulatory obligation but also an ethical imperative, essential to advancing medical knowledge, ensuring public trust, and ultimately improving patient outcomes.
For full reproducibility, project code and methodologies are available at https://github.com/insilica/clinicaltrials-compliance-study.
5 - Supplement
5.1 Replicating Anderson Methodology
Figure 6: Flowchart determining the HLACTs for a given window.

5.1.1 Algorithm for Funding Source

5.1.2 Recreating Table 1 — our algorithm with Anderson data


5.1.3 Survival Curves Comparison
Figure 7: Survival stratified by various variables using Anderson et al.


Table 3: Windows comparing before and after rule-effective date. Observation windows span 4 years, tacking results reported within 3 years.

5.2 Trial Type Composition changes between Window 1 and Window 2
Differences in trial type distribution is something to consider before comparing compliance rates between Window 1 and 2. Figure 8(a) shows the breakdown of subcategories for our entire sample and highlights the proportion of Other/NA values present. Figure 8(b) shows the % change in categories across the two observation windows. For example, industry-funded trials made up 47.4% of trials in Window 1, and 38.5% of trials in Window 2, for a difference of −8.9%. This allows us to roughly approximate the sample sizes of each subcategory and consider the underlying trial type shifts over this time period.


Although the dataset theoretically includes all applicable trials, confidence intervals were calculated to account for potential classification errors introduced by the algorithm for identifying trials. These intervals help assess the robustness of the findings regarding changes in reporting rates between Window 1 and Window 2:
The improvement in reporting within 12 months was +14.9% (95% CI: +14.0%, +15.9%). The
increase in reporting within 36 months was +8.4% (95% CI: +7.2%, +9.7%).
6 - Reporting results compared when accounting for extensions
When trials are given a certification to delay results, per §11.44(b)(2) of the regulation, they are given two years from the date of the certificate submission to submit the result information. To provide a comparable time interval from trial completion to result submission as in the standard deadline trials, this is equivalent to computing the interval to the result submission date from the certification submission date plus one year.
Figure 11: Results before and after the FDAAA Final Rule effective date when accounting for extensions.

References
Zarin DA, Fain KM, Dobbins HD, Tse T, and Williams RJ. Ten-Year Update on ClinicalTrials.gov Results Database. The New England journal of medicine. 2019 Nov 14; 381:1966–74. doi: 10 . 1056 / NEJMsr1907644. Available from: https://www.ncbi.nlm.nih.gov/pmc/articles/PMC8591666/ [Accessed on: 2024 Jun 30]
Food and Drug Administration Amendments Act of 2007. Public Law No. 110-85 § 801. 2007. Available from: https://www.govinfo.gov/content/pkg/PLAW-110publ85/pdf/PLAW-110publ85.pdf#page=82
FDAAA 801 and the Final Rule. ClinicalTrials.gov. 2024 Apr 30. Available from: https://clinicaltrials.gov/policy/fdaaa-801-final-rule [Accessed on: 2024 Sep 25]
Zarin DA, Tse T, Williams RJ, and Carr S. Trial Reporting in ClinicalTrials.gov — The Final Rule. New England Journal of Medicine. 2016 Nov 17; 375:1998–2004. doi: 10.1056/NEJMsr1611785. Available from: https://www.nejm.org/doi/full/10.1056/NEJMsr1611785
National Institutes of Health, Department of Health and Human Services. Clinical Trials Registration and Results Submission. 2014 Nov 21. Available from: https://www.federalregister.gov/documents/2014/11/21/2014-26197/clinical-trials-registration-and-results-submission [Accessed on: 2024 Nov 20]
Clinical Trials Registration and Results Information Submission. 42 CFR Part 11. 2017 Jan 18. Available from: https://www.ecfr.gov/on/2017-01-18/title-42/part-11 [Accessed on: 2024 Nov 20]
Anderson ML, Chiswell K, Peterson ED, Tasneem A, Topping J, and Califf RM. Compliance with Results Reporting at ClinicalTrials.gov. New England Journal of Medicine. 2015 Mar 12; 372:1031–9. doi: 10 . 1056 / NEJMsa1409364. Available from: https://www.nejm.org/doi/full/10.1056/NEJMsa1409364
ML. Factors associated with reporting results for pulmonary clinical trials in ClinicalTrials.gov. Clinical Trials (London, England). 2018 Feb; 15:87–94. doi: 10.1177/ 1740774517740352
DeVito NJ, Bacon S, and Goldacre B. Compliance with legal requirement to report clinical trial results on ClinicalTrials.gov: a cohort study. Lancet (London, England). 2020 Feb 1; 395:361–9. doi: 10.1016/S0140-6736(19)33220-9
Anderson M.D. ML, Chiswell Ph.D. K, Peterson M.D. M.P.H. ED, Tasneem Ph.D. A, Topping M.S. J, and Califf M.D. RM. Project: Compliance with Results Reporting at ClinicalTrials.gov. Version September 27, 2013. 2013 Sep 27. Available from: https://aact.ctti-clinicaltrials.org/shared_data/proj_results_reporting [Accessed on: 2024 May 6]
ClinicalTrials.gov Glossary Terms. ClinicalTrials.gov. 2024 Jul 1. Available from: https://clinicaltrials.gov/study-basics/glossary [Accessed on: 2024 Nov 19]
Study Data Structure. ClinicalTrials.gov. 2024 Apr 1. Available from: https://clinicaltrials.gov/data-api/about-api/study-data-structure [Accessed on: 2024 Nov 19]
Clinical Trials Transformation Initiative (CTTI). Aggregate Analysis of ClinicalTrials.gov (AACT) Database. 2024 Apr 30. Available from: https://aact.ctti-clinicaltrials.org/ [Accessed on: 2024 Apr 30]
Sjoberg DD, Baillie M, Fruechtenicht C, Haesendonckx S, and Treis T. ggsurvfit: Flexible Time-to-Event Figures. Version R package version 1.1.0. 2024. Available from: https://CRAN.R-project.org/package=ggsurvfit
Harris CR, Millman KJ, van der Walt SJ, Gommers R, Virtanen P, Cournapeau D, Wieser E, Taylor J, Berg S, Smith NJ, Kern R, Picus M, Hoyer S, van Kerkwijk MH, Brett M, Haldane A, del Río JF, Wiebe M, Peterson P, Gérard-Marchant P, Sheppard K, Reddy T, Weckesser W, Abbasi H, Gohlke C, and Oliphant TE. Array Programming with NumPy. Nature. 2020 Sep 1; 585:357–62. doi: 10.1038/s41586-020-2649-2. Available from: https://doi.org/10.1038/s41586-020-2649-2
National Institutes of Health, Department of Health and Human Services. NIH Policy on the Dissemination of NIH-Funded Clinical Trial Information. 2016 Sep 21. Available from: https://www.federalregister.gov/documents/2016/09/21/2016-22379/nih-policy-on-the-dissemination-of-nih-funded-clinical-trial-information [Accessed on: 2025 Jan 17]
Improving Timely, Accurate, and Complete Registration and Reporting of Summary Results Information on ClinicalTrials.gov. Clinical Trials Transformation Initiative, 2024 Jan 10. Available from: https://ctti-clinicaltrials.org/topics/quality/reporting-challenges/ctti-and-fda-share-strategies-for-improving-timely-accurate-and-complete-registration-and-reporting-of-summary-results-information-for-applicable-clinical-trials-on-clinicaltrials-gov/ [Accessed on: 2024 Oct 2]
